THE DIWALI SKILL EDIT Starts 10 November 2026 · 60-day internship includedExplore the ₹499 offer ↗
DIWALI CAREER SKILL BUNDLEFROM BUSINESS DATA TO DECISIONS.
STARTS 10 NOVEMBER 2026Weekend live classes · Recordings available

Become aPower BI Developer.

₹8.76L / year*India BI Developer
average base salary

*Indeed benchmark across experience levels: 18 reported salaries, updated 25 September 2026. Broader BI role, not Power BI-only or a guaranteed starting salary. Salary source ↗

Beginner friendlyFor studentsFor working professionals
1-month live course+60-day Power BI internship

Start from the fundamentals, whether you’re a student, a complete beginner or a working professional planning a career change. Build reporting skills through live weekend classes, recordings and a 60-day project internship.

₹7,999₹499Diwali offer
Save ₹7,500 on the reference course price
✓ 1-month course + ✓ 60-day internship
Enroll for 10 November — ₹499 ↗Review the course and internship details, then complete secure checkout.
BUILD.Illustrative learner using a laptop
From data to decisionsYour dashboard journey
Learn. Apply. Explain.One skill-building bundle
Illustrative campaign visual

1-month course

Live online classes + recordings available

60-day internship

Apply your skills through project work

A dashboard to explain

Practise with a business reporting problem

Completion pathway

Documents after work, assessment and dates

YOUR JOURNEY AT A GLANCE

Learn the tools. Build the work.
Show what you can do.

01

Learn

1-month Power BI course

Connect, clean, model and visualise data.

02

Apply

60-day project internship

Follow the brief and build your evidence.

03

Complete

Assessment + required dates

Submit, improve and meet completion criteria.

THE SKILL BEHIND THE SCREEN

Don’t just look at data.Make it mean something.

Three steps behind every useful dashboard.

SCROLL TO EXPLORE ↓
01 / FIND THE SIGNAL
Sales exportCSV
RegionSalesCheck
South42,000✓
NorthMissingReview
West63,000✓

Messy is where
the learning starts.

Learn to question the source, clean the columns and check what the numbers really represent.

02 / CONNECT THE DOTS
PRODUCTSDATES
SALESConnect tables. Check relationships.

One connected model.
Better questions.

Build relationships and measures so your report has a clear logic behind it.

03 / TELL THE STORY
FROM A CHART TO A CONVERSATION“What should
we look at next?”

Build something
you can explain.

Choose useful visuals, describe the insight and be honest about the limitations.

Illustrative graduate holding a laptop and presenting
LEARN → APPLY → EXPLAIN

A skill to practise.
A project to build.
A story to tell.

1-month Power BI course + 60-day Power BI / Data Analytics Project Internship.

Explore the ₹499 offer Illustrative campaign image
BUILD TOWARDS A CAREER IN DATA

Your next move?
Make it Power BI.

Start building the reporting, dashboard and data-storytelling skills relevant to business intelligence work.

LEARN THE SKILL1-month live
Power BI course
Weekend classes + recordings
+
PUT IT INTO PRACTICE60-day Power BI /
Data Analytics Internship
Remote, project-based internship
THE COMPLETE BUNDLE
₹7,999₹499
Save ₹7,500One payment · Internship included
Get the complete bundle for ₹499 Build practical skills at your pace. Employment and placement are not guaranteed.
SEE WHERE THE SKILLS CAN FIT

Learn the work.
Explore the roles.

Explore the roles behind the skills. These are India market averages across experience levels, not fresher salaries, vacancies or guaranteed course outcomes. Pay varies by experience, location and employer.

CAREER DIRECTION

Power BI Developer

Build reports and dashboards

Data modelling · DAX · interactive reports
₹8.76L / yearIndia average base salary · Indeed18 reports · Updated 25 September 2026Broader BI Developer benchmark; not Power BI-only.Check salary source ↗
Build the foundations
CAREER DIRECTION

Data Analyst

Turn business data into findings

Data cleaning · analysis · communicating insights
₹6.25L / yearIndia average base salary · Indeed526 reports · Updated 19 October 2026Check salary source ↗
Build the foundations
CAREER DIRECTION

BI Analyst

Connect measures to business questions

Relationships · KPIs · reporting logic
₹7.07L / yearIndia average base salary · Indeed3 reports · Updated 26 April 2026Small sample: only 3 reported salaries.Check salary source ↗
Build the foundations
CAREER DIRECTION

Reporting / MIS Analyst

Make regular reporting clearer

Structured data · report accuracy · presentation
₹20,877 / monthIndia average base salary · Indeed275 reports · Updated 21 May 2026Check salary source ↗
Build the foundations
WHEN SOMEONE ASKS “WHAT CAN YOU DO?”

Have more than
a course name to say.

Explain your approach

Why did you clean a column or create a relationship?

Walk through your report

What question does each chart answer?

Discuss your checks

How did you verify the totals and spot limitations?

Show project evidence

What did you build, submit and improve?

Turn interest into practice — explore ₹499 offer ↗
MAKE YOUR LEARNING VISIBLE

More than knowing
where to click.

Practise the whole reporting workflow—and explain the decisions behind your dashboard.

Explore the ₹499 bundle ↗
YOUR PRACTICE OUTPUT / 01

A cleaner dataset

Know what to fix before you make a chart.

↗
YOUR PRACTICE OUTPUT / 02

A model that makes sense

Connect tables and understand your measures.

↗
YOUR PRACTICE OUTPUT / 03

A report you can explain

Show the question, the chart and the insight.

↗
FROM THIS → TO THIS

Messy spreadsheet.
Clear business story.

Follow the transformation. This is the thinking you’ll practise.

STEP 01

Raw spreadsheet

Start with rows, missing values and mixed formats.

MonthRevenueRegionJan42,000southFeb—NORTHFeb—NORTHMar63000West
EXPLORE WHAT YOU’LL LEARN TO BUILD

One report.
The whole business picture.

Explore revenue, categories, regions and products. Try the region filter to see the report respond.

POWER BI-STYLE REPORT / DEMO DATA

Sales performance

YOUR 30-SECOND CHALLENGEWhich products drive sales in the South? Choose South, then open a product to investigate.
Revenue₹8.42LFiltered illustrative data
Products6Filtered illustrative data
Est. orders1,247Filtered illustrative data
Target progress84%Filtered illustrative data
Revenue through JunTap a month to change the reporting period
Choose a category
6products
Compare regions
Explore matching products
ProductRevenueTrend
₹2.18L+24%
₹2.00L+18%
₹1.42L+16%
₹1.06L+9%
₹0.98L+12%
₹0.78L+7%
Illustrative data, not a student result. Explore with the controls; all values come from this demo dataset.
ONE MONTH. A CLEAR LEARNING PATH.

A reporting workflow.
Not isolated clicks.

Beginner-friendly live classes on Saturdays and Sundays, with recordings available. Explore your four-week learning path.

01

Start with the business question

Turn a reporting request into a clear question. Connect spreadsheet exports, identify what each row represents and define the measures a decision-maker needs.

Business questionsData connectionsKPI definitions
LEARN IT. APPLY IT.

One month to learn.
60 days to apply it.

RemoteUnpaidSelf-directed
Learn the skill

Follow the Power BI learning path.

1
Build your project

Apply it during the 60-day internship.

2
Submit your work

Upload the evidence required in your brief.

3
Earn completion

Meet the work, assessment and date requirements.

4
THE WORK. THE PROOF. THE NEXT CHAPTER.

Two achievements.
Clearly recognised.

A course builds your knowledge. An internship puts it into practice. Explore the different documents—and what you need to earn each one.
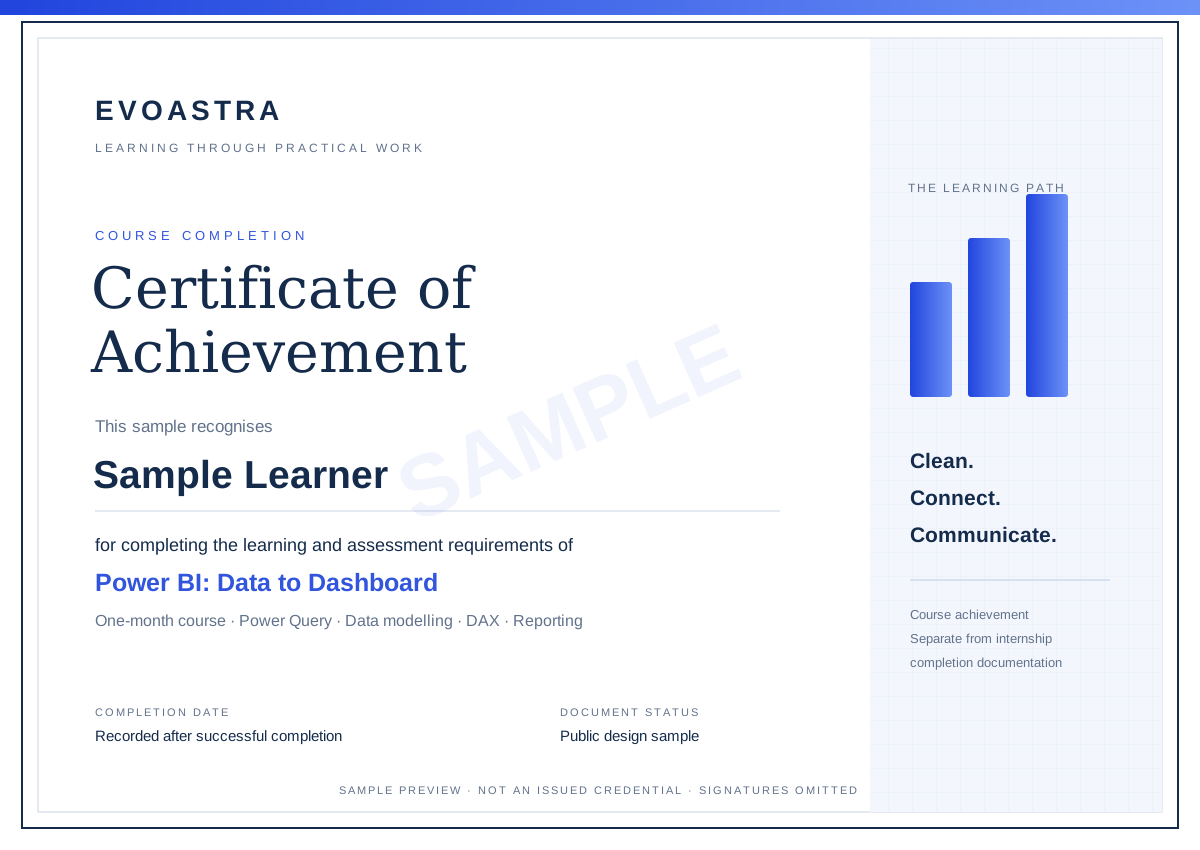
DESIGN EXAMPLECourse certificate public design sample; not an issued document
01 / LEARN

Your learning, recognised.

A separate Power BI course certificate with its own design. It recognises successful course completion—not an internship period.

When it becomes available

After the course learning and assessment requirements are met.

Public samples use example details and omit signatures. They are not issued credentials. Actual details depend on the student’s eligible programme and records.
1 / 5
MAKE THIS DIWALI A NEW START

Your course.
Your internship.
One ₹499 payment.

Enter your details to enroll in the Power BI course with the included 60-day Data Analytics project internship.

₹499 Diwali offerCourse reference price ₹7,999 · Save ₹7,500 · Internship included

Weekend live classes on Saturdays and Sundays, with recordings available. For confirmed class timings and recording access details, ask for the timetable on WhatsApp ↗.

You’ll need a suitable computer and internet access. Power BI Desktop requires a supported Windows environment. Any optional Microsoft service or licence requirements will be explained before enrollment.

STARTS 10 NOVEMBER 2026

Enroll in Power BI for ₹499

1-month live Power BI course + recordings60-day project internship includedTotal payable ₹499One-time payment · No recurring subscription
Review the course and internship terms

₹499 total, one-time, for a one-month Power BI course starting 10 November 2026, delivered through weekend live online classes on Saturdays and Sundays with recordings available, plus a separate 60-day remote, unpaid, self-directed Power BI / Data Analytics project internship. No recurring subscription. Class times and recording-access details must be confirmed with the team. Internship dates start separately on eligible project activation. Course completion and internship completion are distinct. Course certification requires completed learning modules, an approved course assessment and the original course end date having passed; internship documents require applicable project work, assessment and elapsed original dates. Recommendation eligibility depends on performance criteria. No job, placement, stipend or personal mentor is guaranteed. Full refund requests are accepted within 24 hours of successful payment; no partial refunds. Existing accounts, passwords and previously issued documents remain unchanged.

₹499 total · One-time payment · Course + 60-day internship.

Before you join.

Are classes live? Will recordings be available?

Yes. The one-month Power BI course includes live online classes and recordings. Ask the team for the class timetable and recording access details before enrolling.

When does the course start?

The Power BI course starts on 10 November 2026. Your internship has its own activation and completion dates. Course completion does not automatically complete the internship.

Is the 60-day internship included?

Yes. The offer includes a 60-day project-based internship. Its start date, project requirements and completion criteria will be provided during enrollment.

Do I need prior experience?

The learning path starts with fundamentals. Comfort using a computer and basic spreadsheets will help.

Does this guarantee a job or certificate?

No job or placement is guaranteed. Completion documents require meeting the internship work, assessment and date requirements.

What happens after payment?

Enrollment is confirmed only after the payment is verified. Follow your private access email. Internship dates start when you activate the project.

TAKE THE DETAILS WITH YOU

Your complete
programme guide.

Course outline, the ₹499 offer and the included 60-day internship.

Download the brochure ↓Ask us on WhatsApp ↗
₹7,999₹499Save ₹7,500
1-month live course + 60-day internship
Get the offer ↗